
Analyses
This page describes the available metrics for each of the three analysis categories. For an introduction to how to use them, see Statistics — Overview.
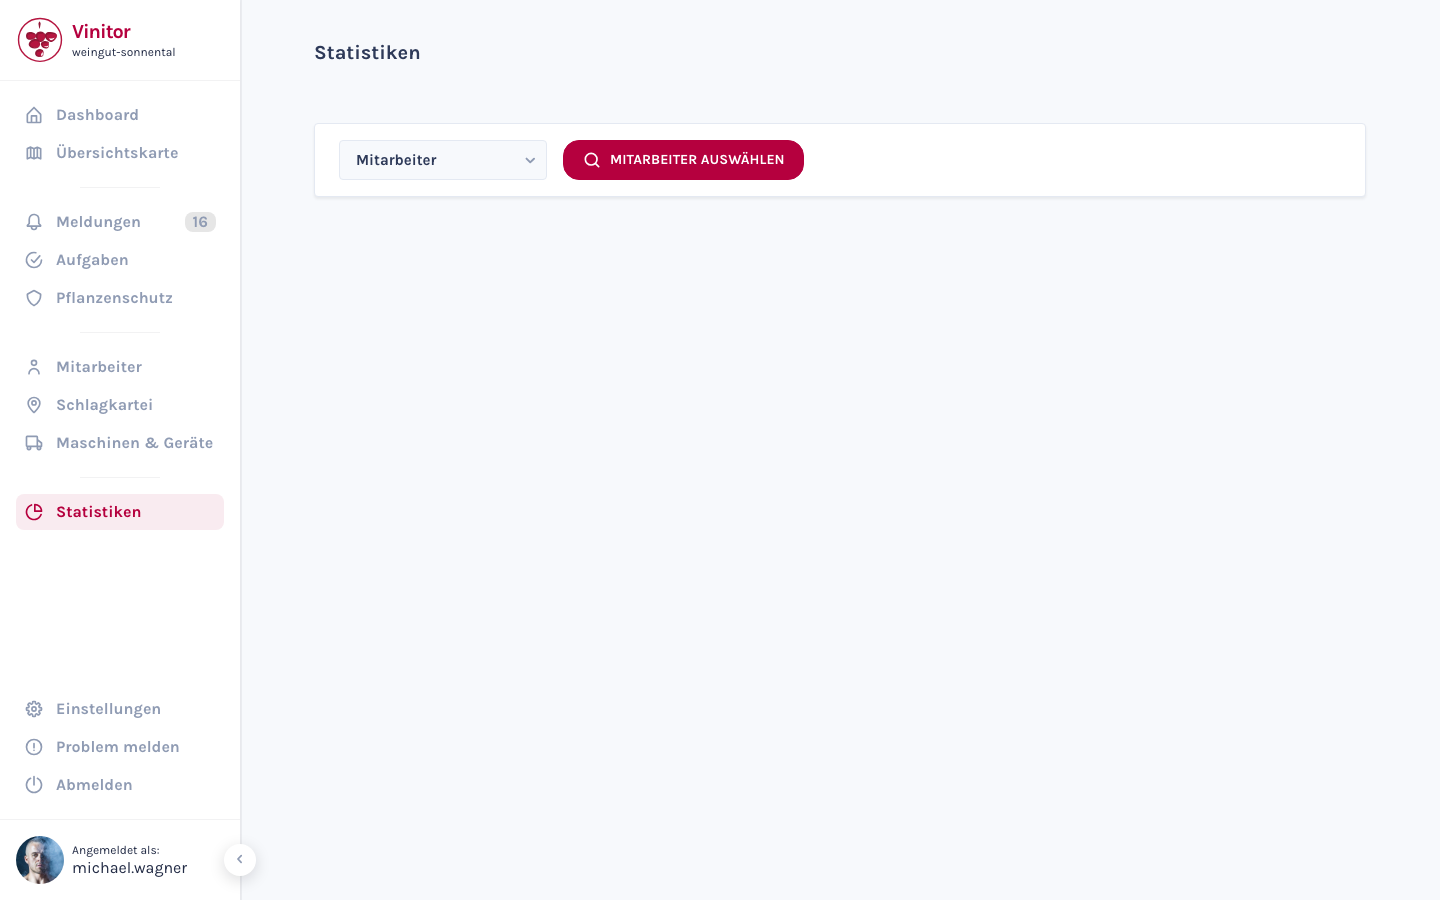
Employee statistics
Section titled “Employee statistics”Shows working time and costs for a single employee over the selected period.
Overview tab
Section titled “Overview tab”| Metric | Description |
|---|---|
| Working hours | Total recorded working hours |
| Staff costs | Calculated staff costs in € |
| Pie chart | Tasks by status (see pie chart) |
| Most frequent task type | The task type the employee was assigned to most often |
| Working days | Number of days with recorded working time |
| Annual leave days | Number of annual leave days |
| Reports filed | Number of reports created by the employee |
| Report types | Number of different report types |
History tab
Section titled “History tab”List of the employee’s completed tasks, grouped by date.
Vineyard statistics
Section titled “Vineyard statistics”Shows working time, costs and further metrics for one or more vineyards.
Overview tab
Section titled “Overview tab”| Metric | Description |
|---|---|
| Working hours | Total recorded working hours |
| Staff costs | Calculated staff costs in € |
| Equipment & machinery hours | Total hours of use for equipment and machinery |
| Equipment & machinery costs | Calculated costs for equipment and machinery in € |
| Total | Total costs (see total cost calculation) |
| Pie chart | Tasks by status (see pie chart) |
| Custom fields | Aggregated values from the custom fields of the associated task types |
| Cultivation days | Number of days on which work was carried out |
| Reports filed | Number of reports for the vineyard |
| Report types | Number of different report types |
History tab
Section titled “History tab”List of completed tasks for the selected vineyards, grouped by date.
Task type statistics
Section titled “Task type statistics”Shows working time, costs and deadline compliance for a single task type.
Overview tab
Section titled “Overview tab”| Metric | Description |
|---|---|
| Working hours | Total recorded working hours |
| Staff costs | Calculated staff costs in € |
| Equipment & machinery hours | Total hours of use for equipment and machinery |
| Equipment & machinery costs | Calculated costs for equipment and machinery in € |
| Total | Total costs (see total cost calculation) |
| Pie chart | Tasks by status (see pie chart) |
| Custom fields | Aggregated values from the custom fields of the associated task types |
| Cultivation days | Number of days on which work was carried out |
| Missed deadlines | Number of tasks whose due date has passed |
History tab
Section titled “History tab”List of completed tasks for this task type, grouped by date.
Task pie chart
Section titled “Task pie chart”The pie chart shows the distribution of tasks by status. The total number of all tasks is shown in the centre.
| Segment | Colour |
|---|---|
| Created | Dark purple |
| Started | Light blue |
| Paused | Orange |
| Done | Green |
Click the chart to open a modal with the full task list — there, tasks are grouped by status and colour-coded.
Total cost calculation
Section titled “Total cost calculation”Total costs for vineyard and task type statistics are calculated as follows:
Total = Staff costs + Equipment & machinery costs + custom Euro fields
Custom fields
Section titled “Custom fields”For vineyard and task type statistics, the custom fields of all associated task types are shown aggregated. Each field is shown as a sum across all tasks in the selected period.
Fields of type Euro are also included in the total costs.
Next steps
Section titled “Next steps”SUPPORT
Need help?
Our team is happy to help with any questions about Vinitor.