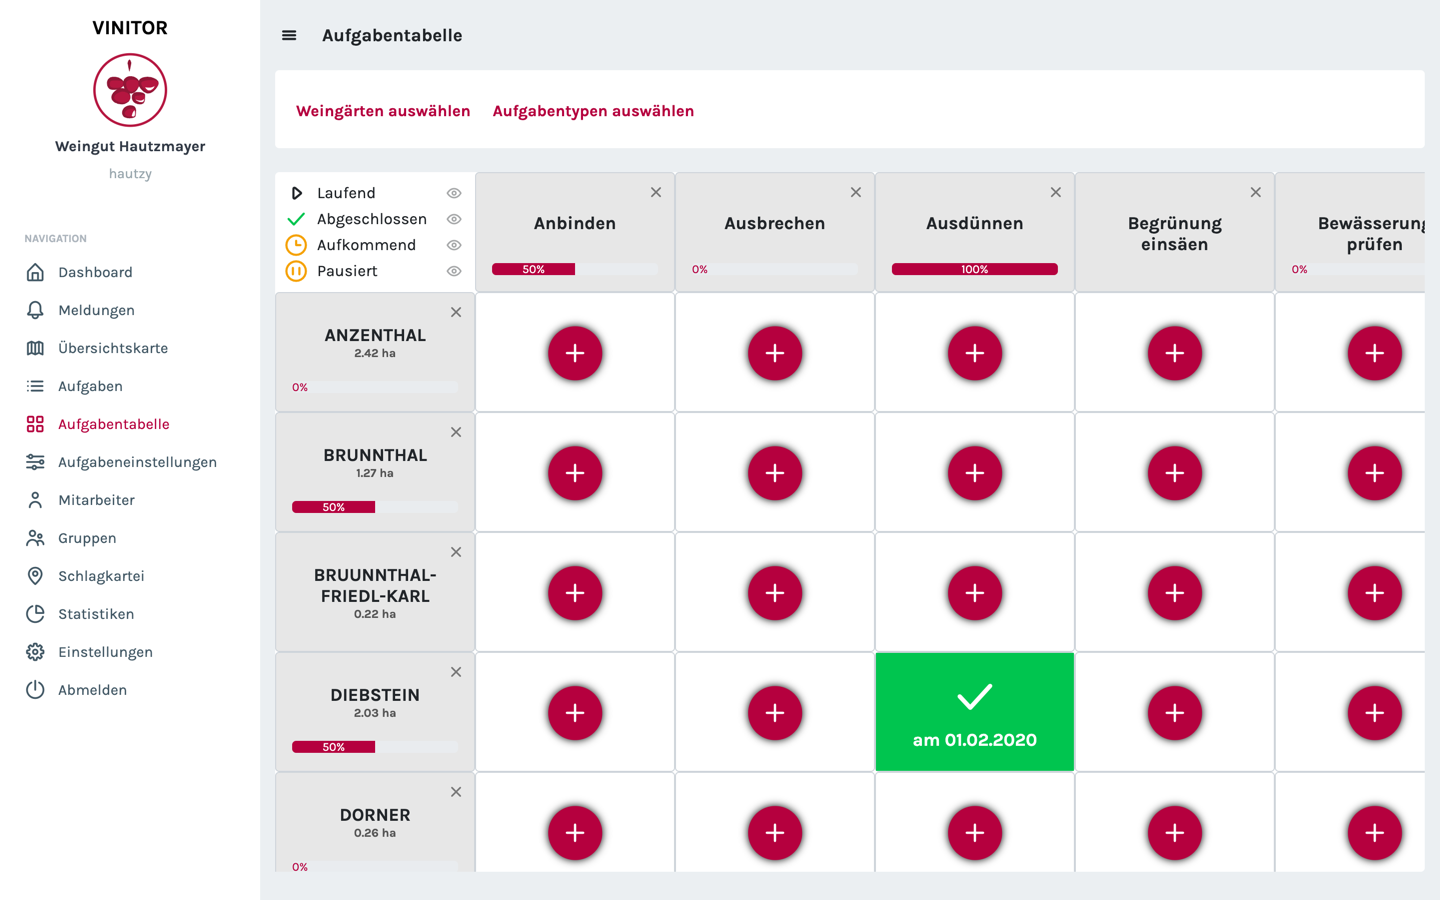
The task list shows what there is to do. But for seasonal planning you need the big picture: which work is due in which vineyard — and how far along is it?
The new task table makes exactly that visible. Vineyards are in the rows, task types in the columns. Each cell shows the task’s status in colour — green for done, orange for paused — and via the plus you create a missing task directly in the right cell:
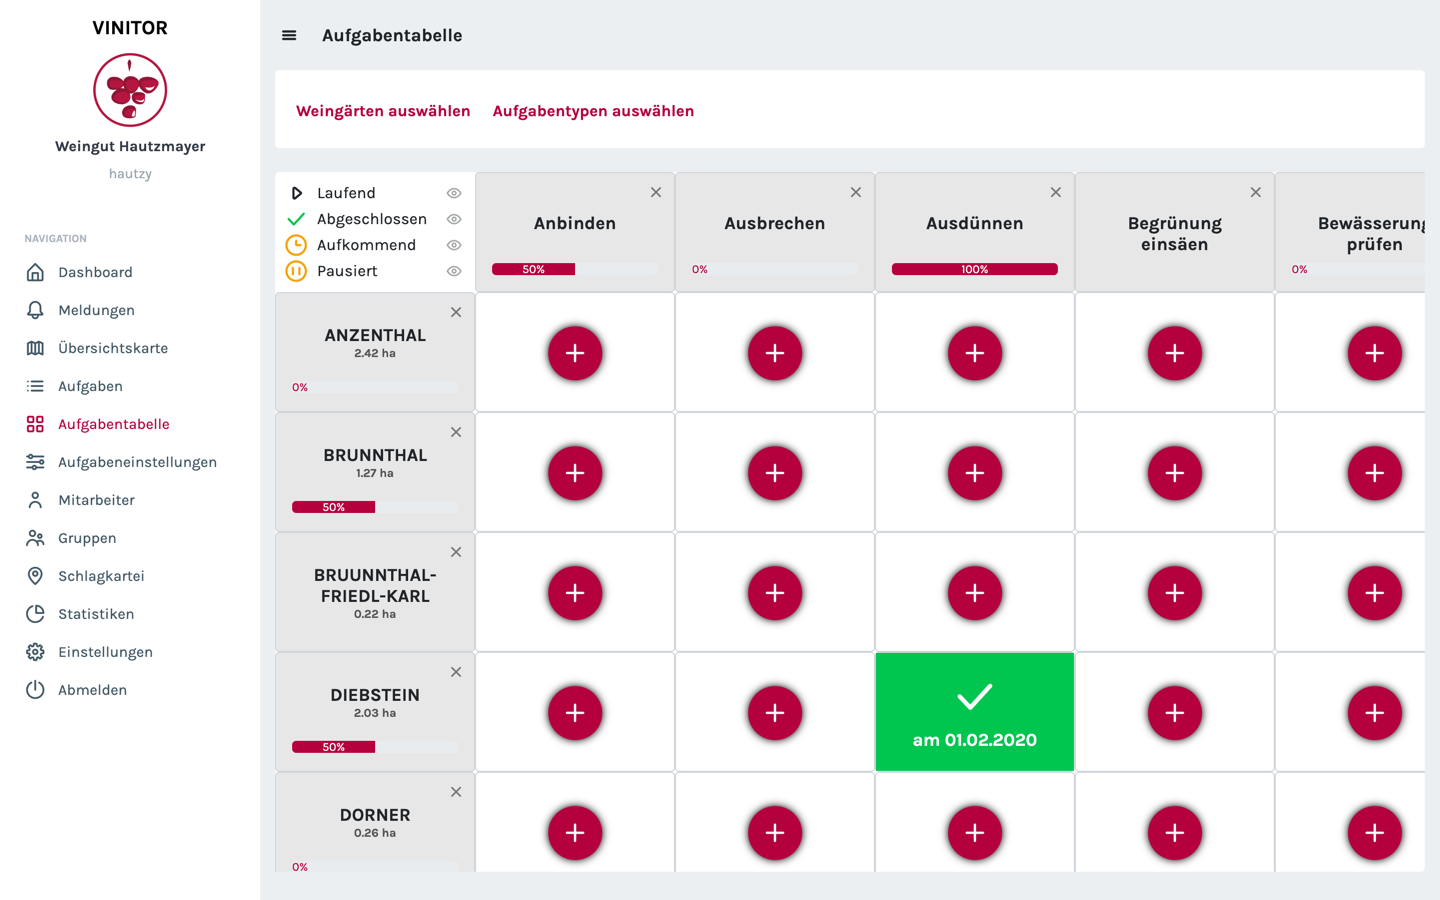
Progress bars per row and column show the overall status of each vineyard and each task type. The status legend at the top left lets you show and hide individual statuses — so you can concentrate, for example, on running work only. And with the selection fields above the table, the grid is narrowed down to the relevant vineyards and task types.
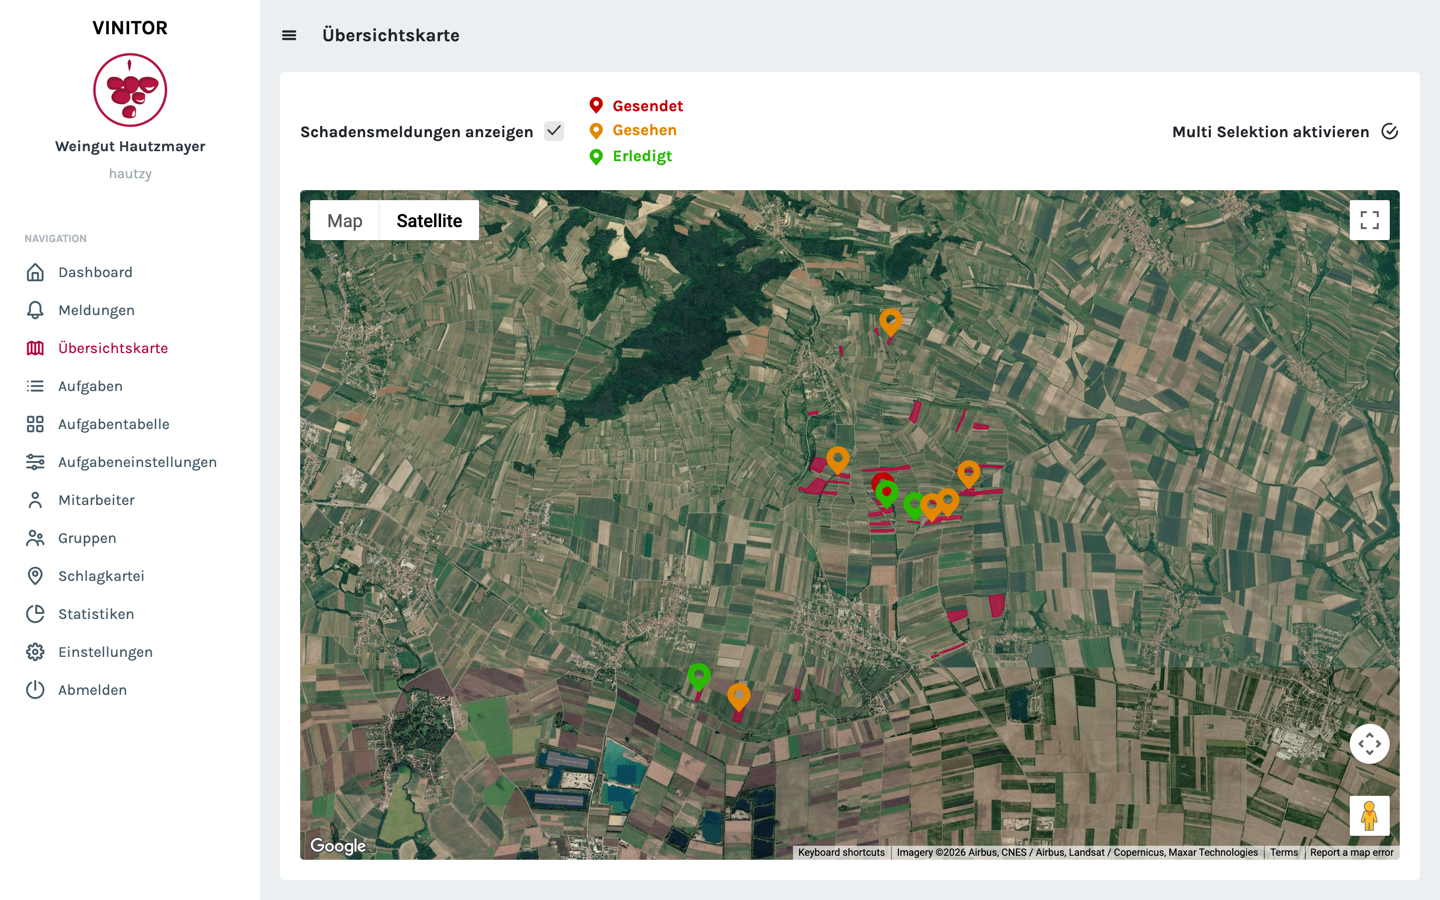
The overview map has learned something too: damage reports now appear as markers directly on the map, distinguished by colour according to status:
✨ Improvements
- Table view — vineyards as rows, task types as columns
- Colour-coded status per cell (in progress, paused, done)
- Progress display per vineyard and per task type
- Status filter — show and hide individual task statuses
- Status legend for the colour codes
- Report markers on the map overview