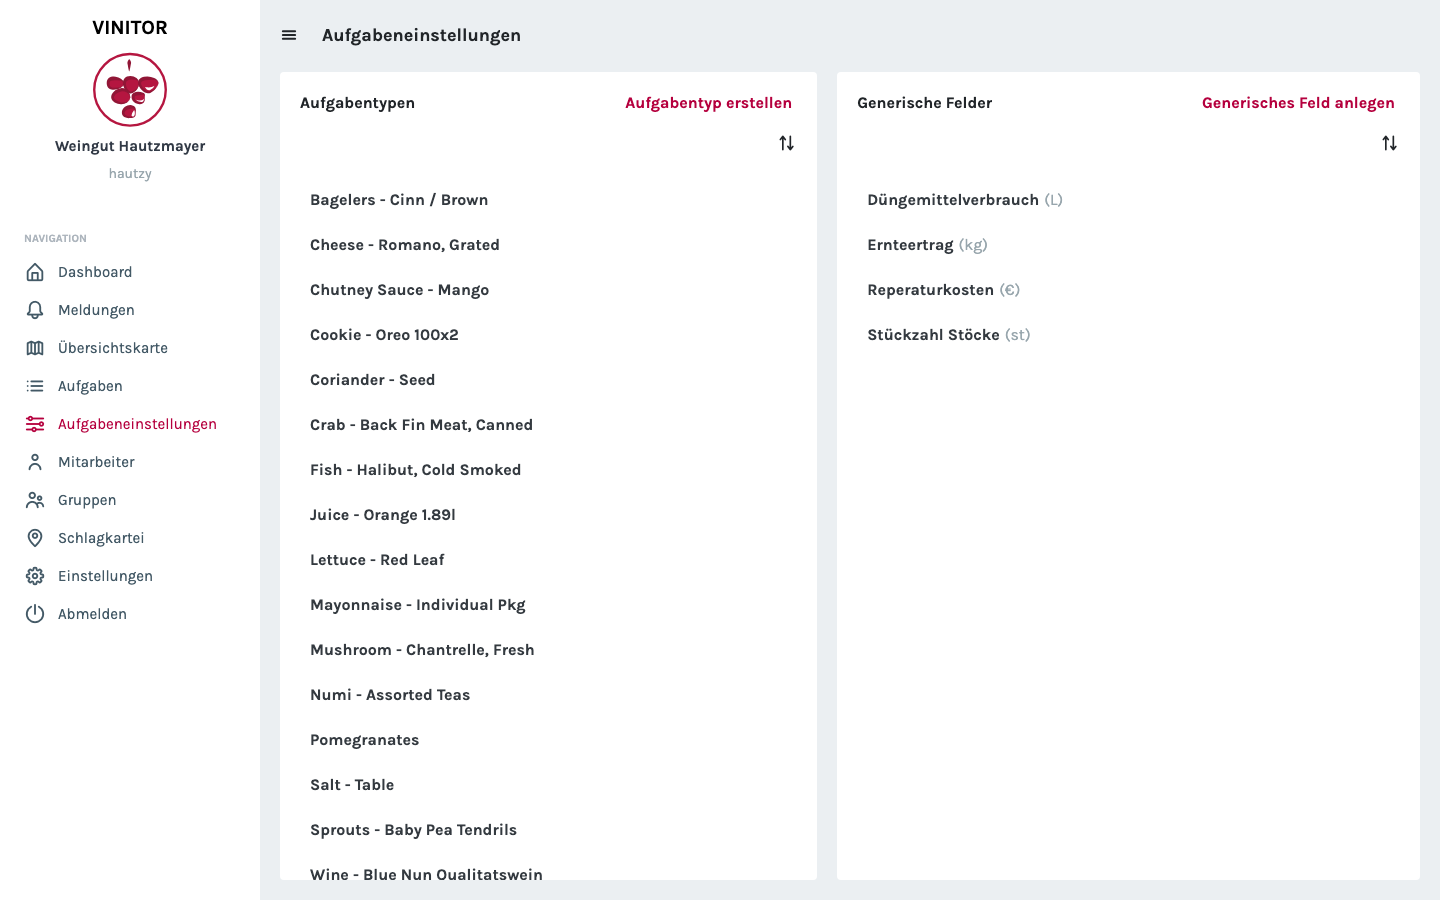
Every business records different things: one measures the must weight at harvest, another the amount of fertiliser, a third both plus the repair costs. Generic fields now make this possible to capture — per task type you can define your own data fields that then appear on every task of that type.
Generic fields
The task settings now have a second area next to the task types: “Generic fields”. This is where reusable data fields with a name, unit and description are created — for example fertiliser consumption in litres or number of vines in units.
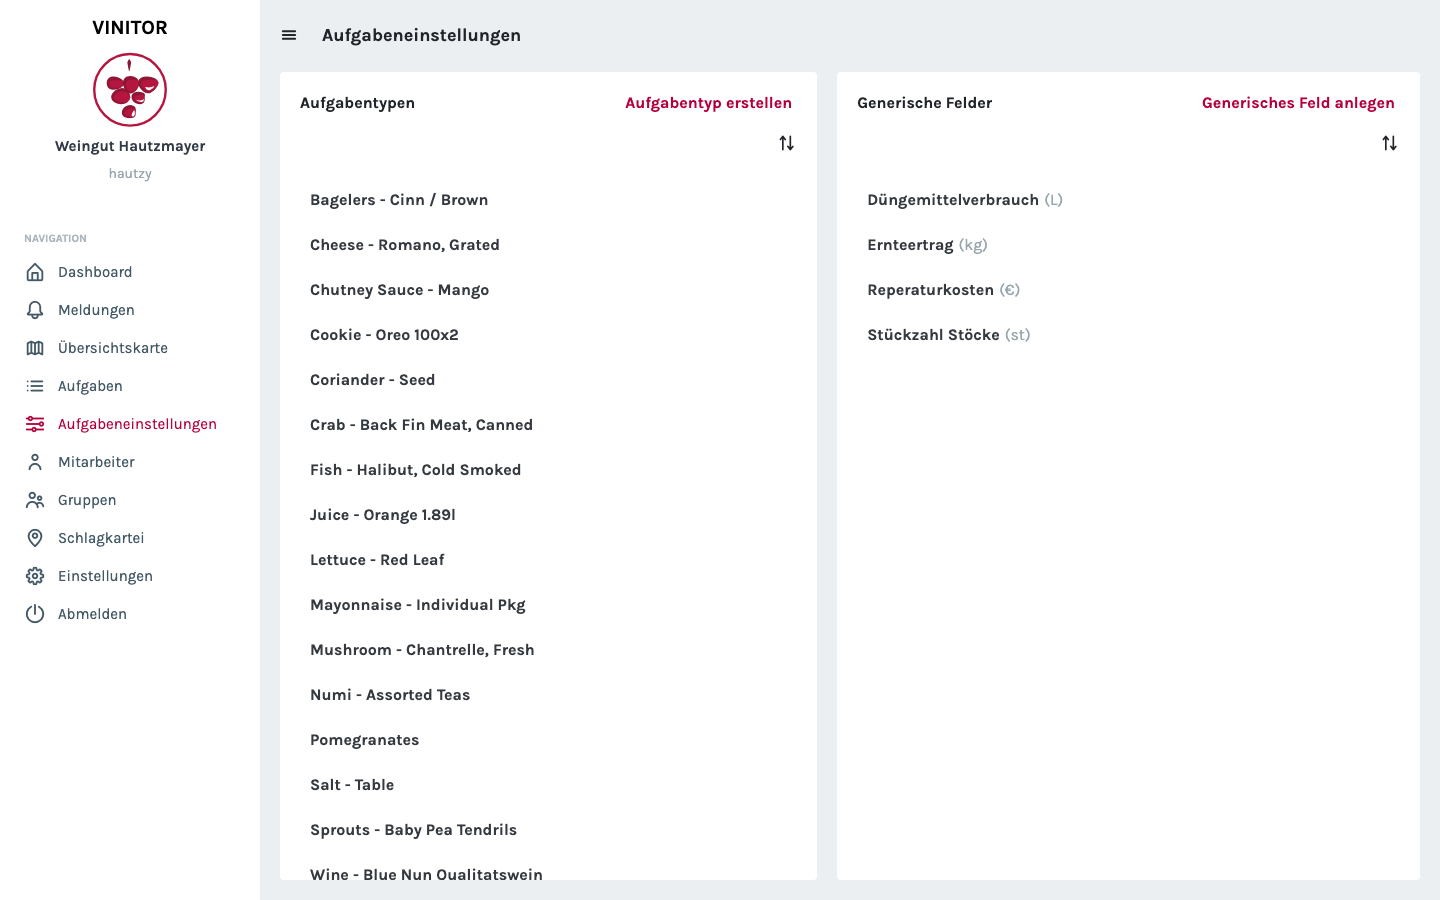
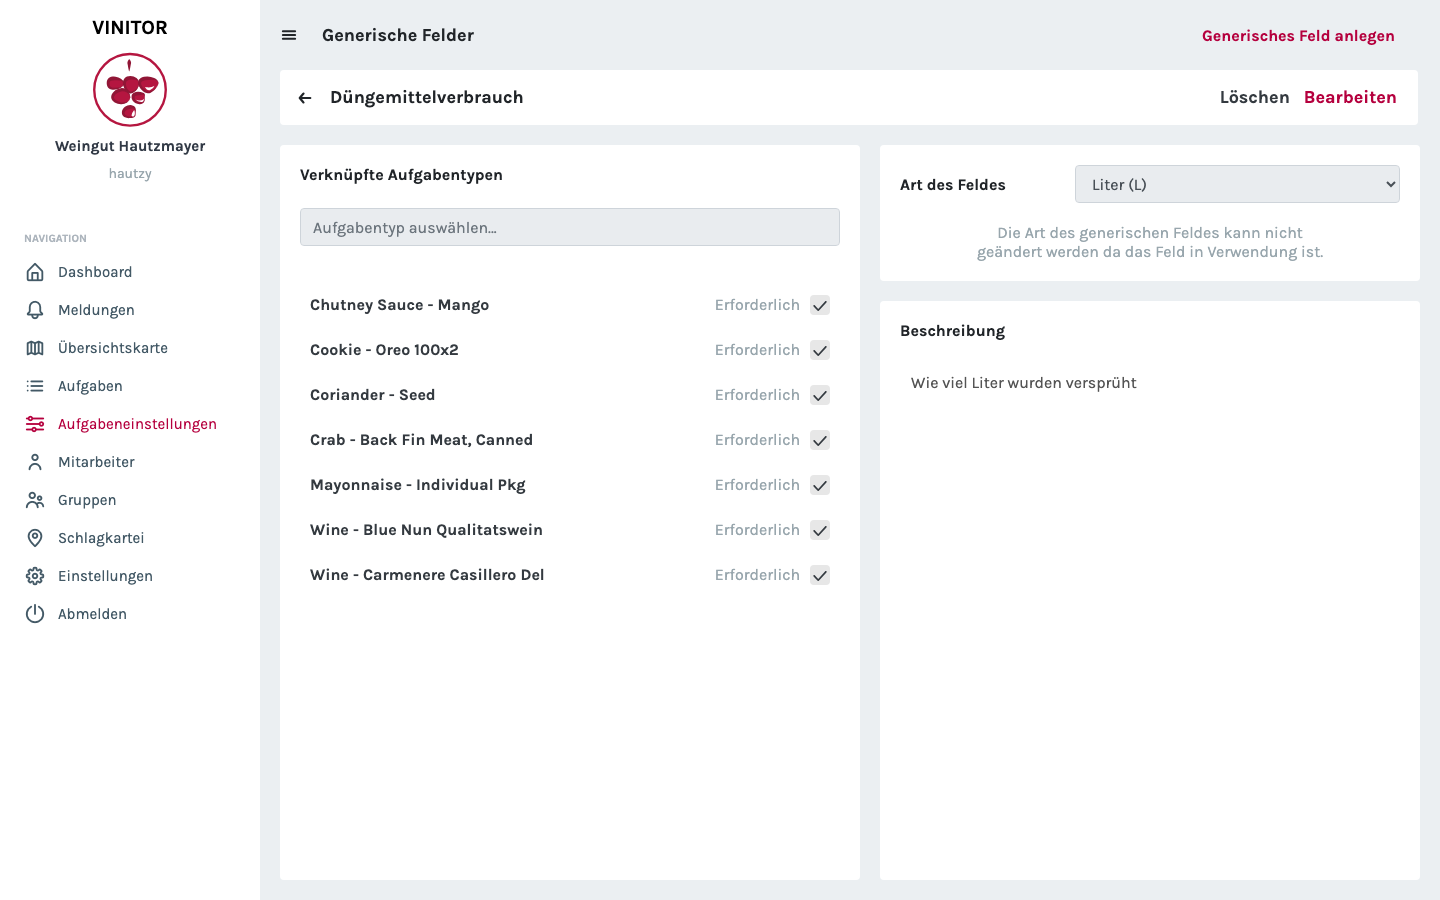
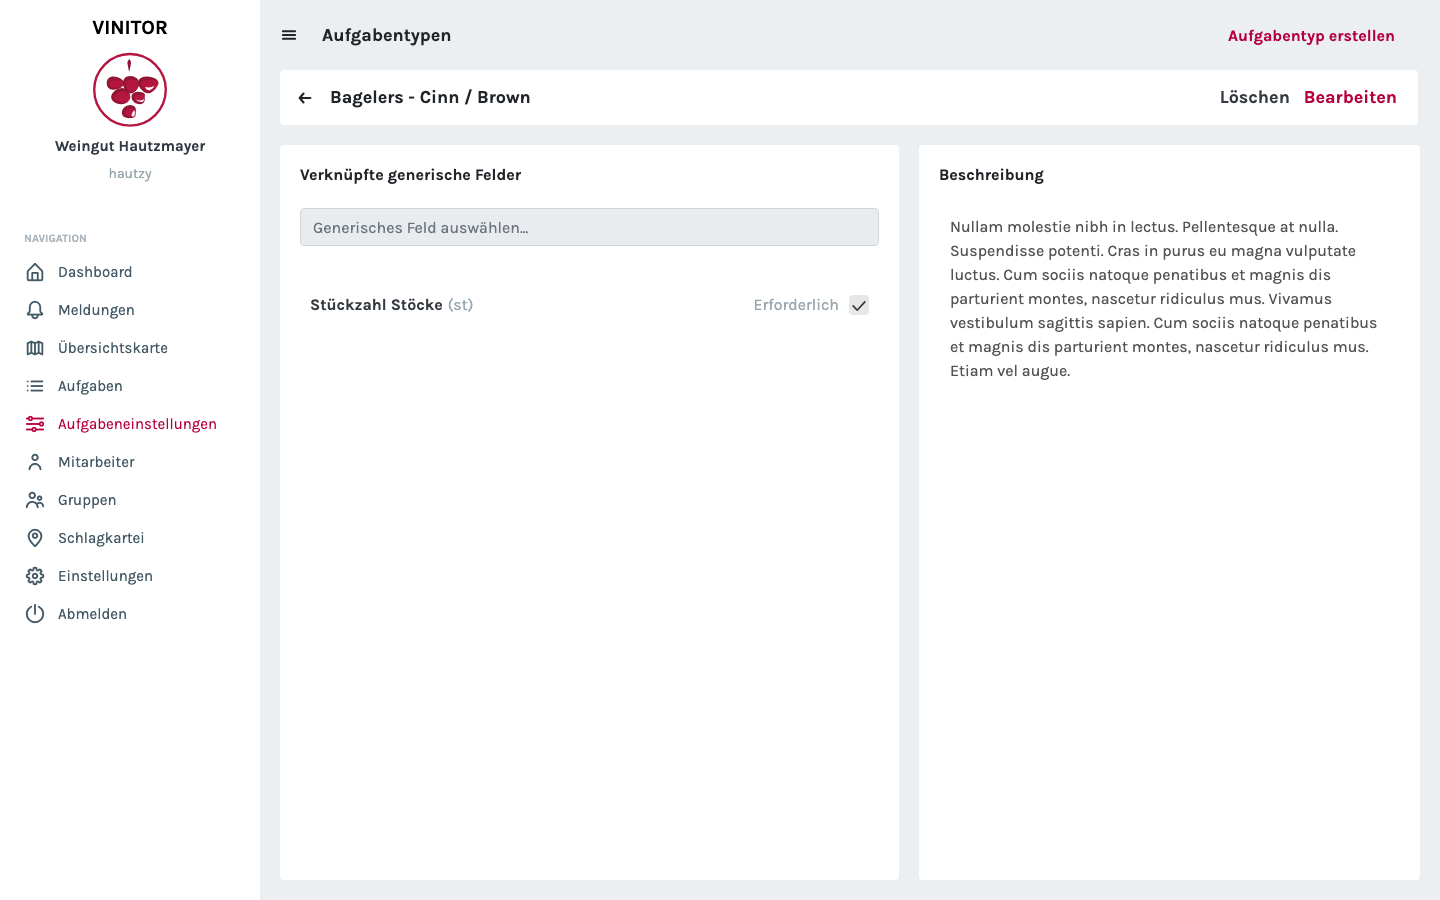
Each generic field can be assigned to any task types. The field’s detail view shows which task types use it and whether it is configured there as a required field.
Overview map
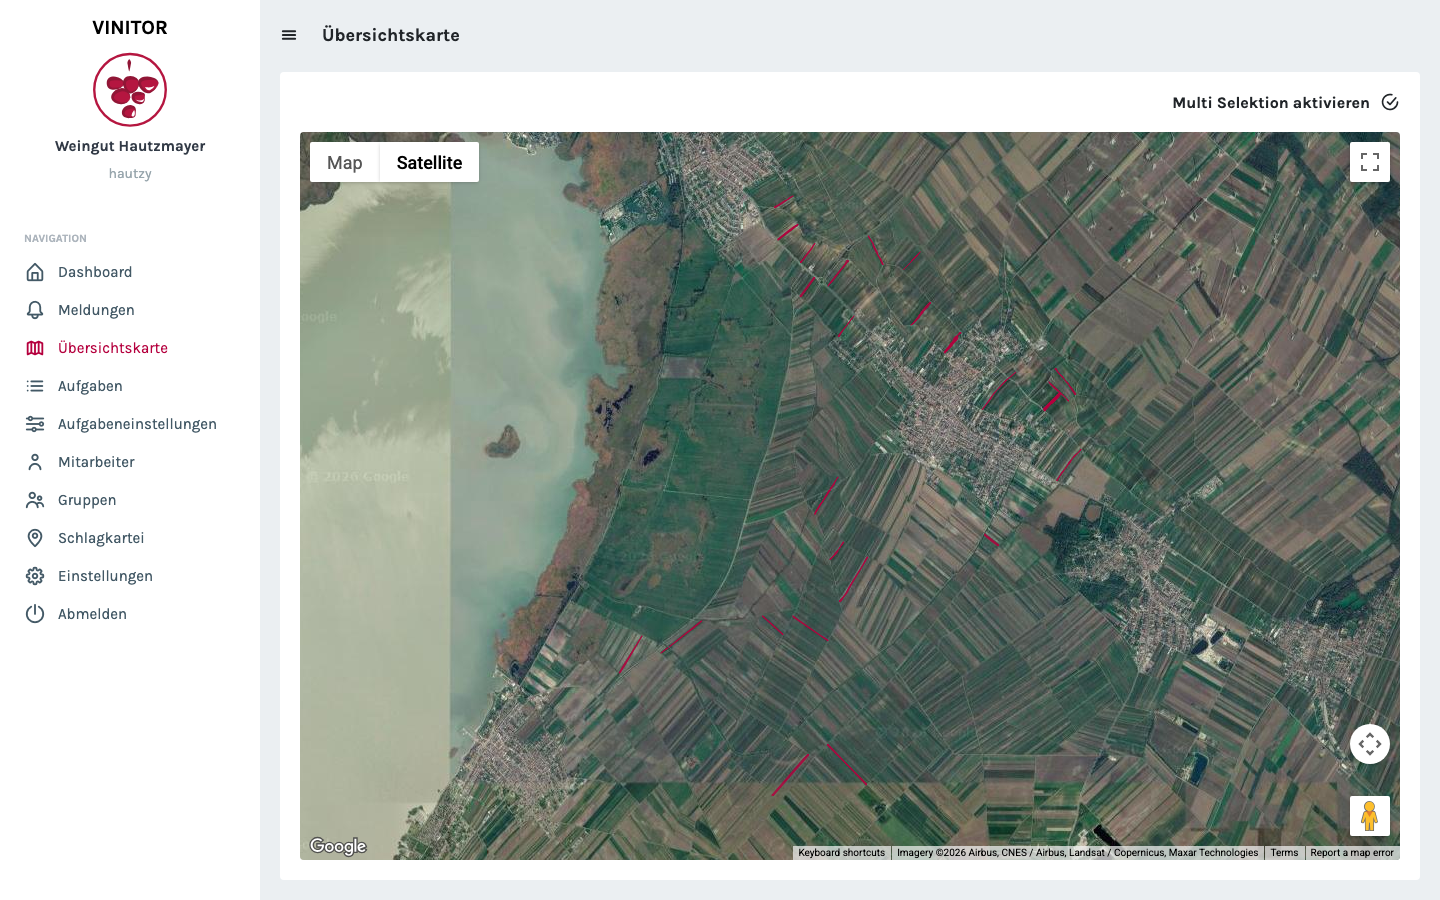
New in the sidebar: “Overview map”. All of the business’s vineyards appear on an interactive map with a satellite view. Incoming reports are shown as markers at their GPS position.
Statistics with filter dialogs
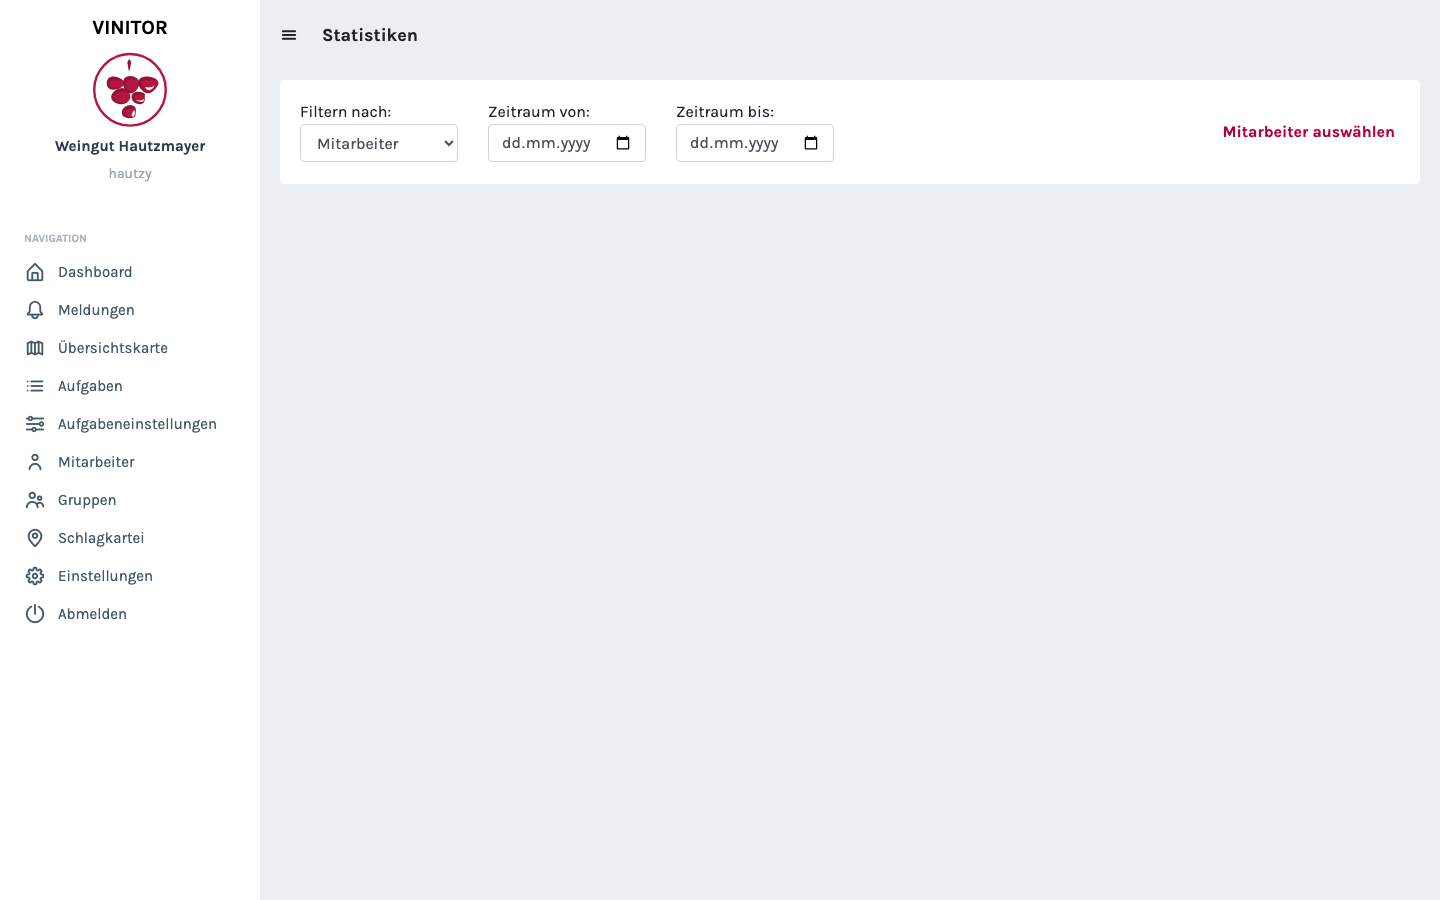
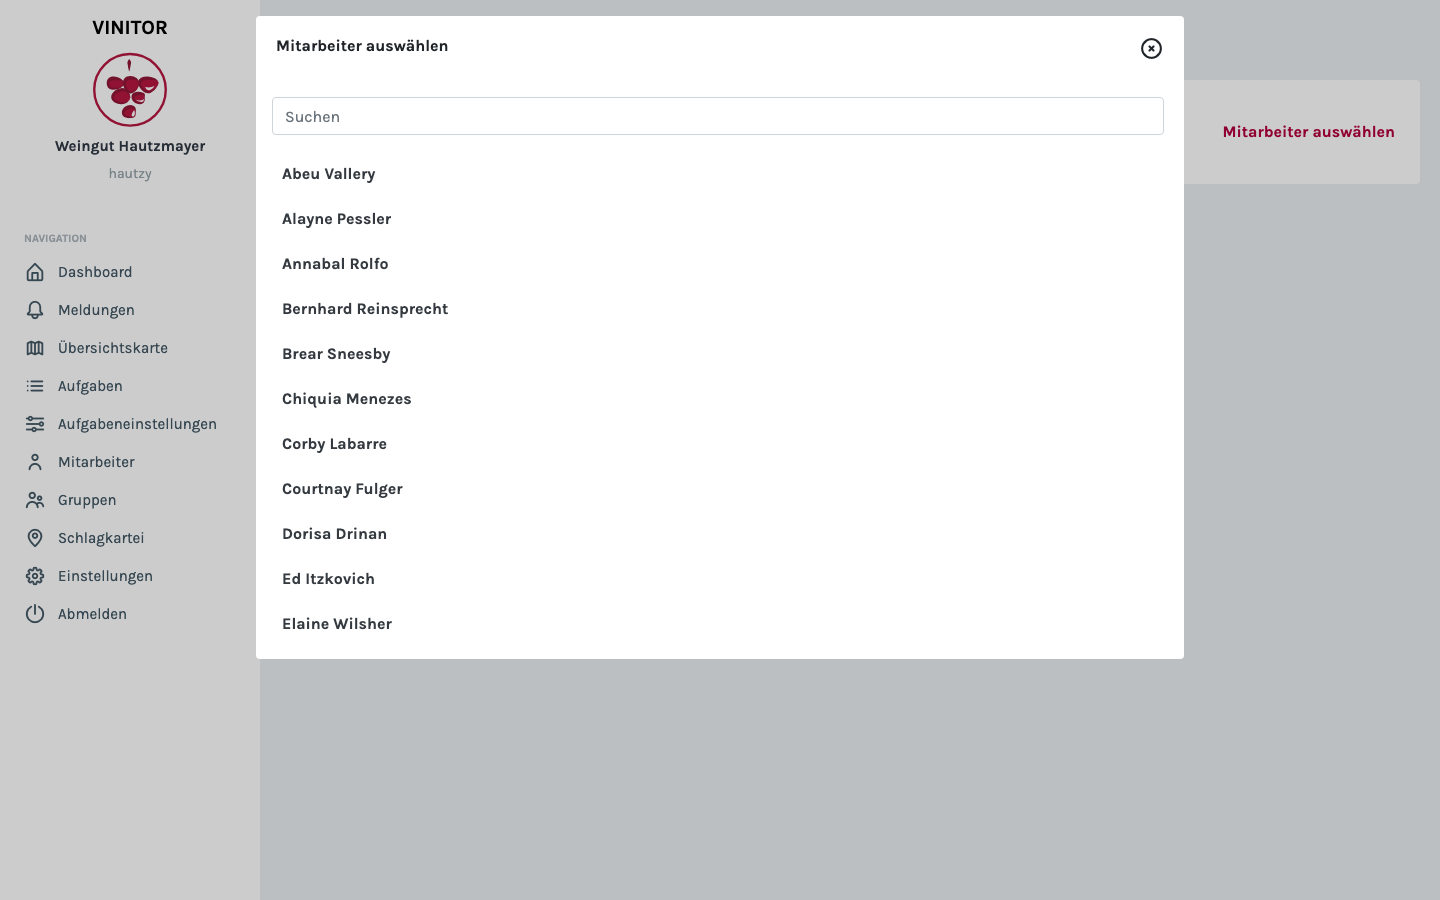
The statistics page has been reworked: selection modals let you filter specifically by employees, vineyards and periods, instead of always seeing all the data. Handy for monthly analyses or comparing individual employees.
Task detail and groups
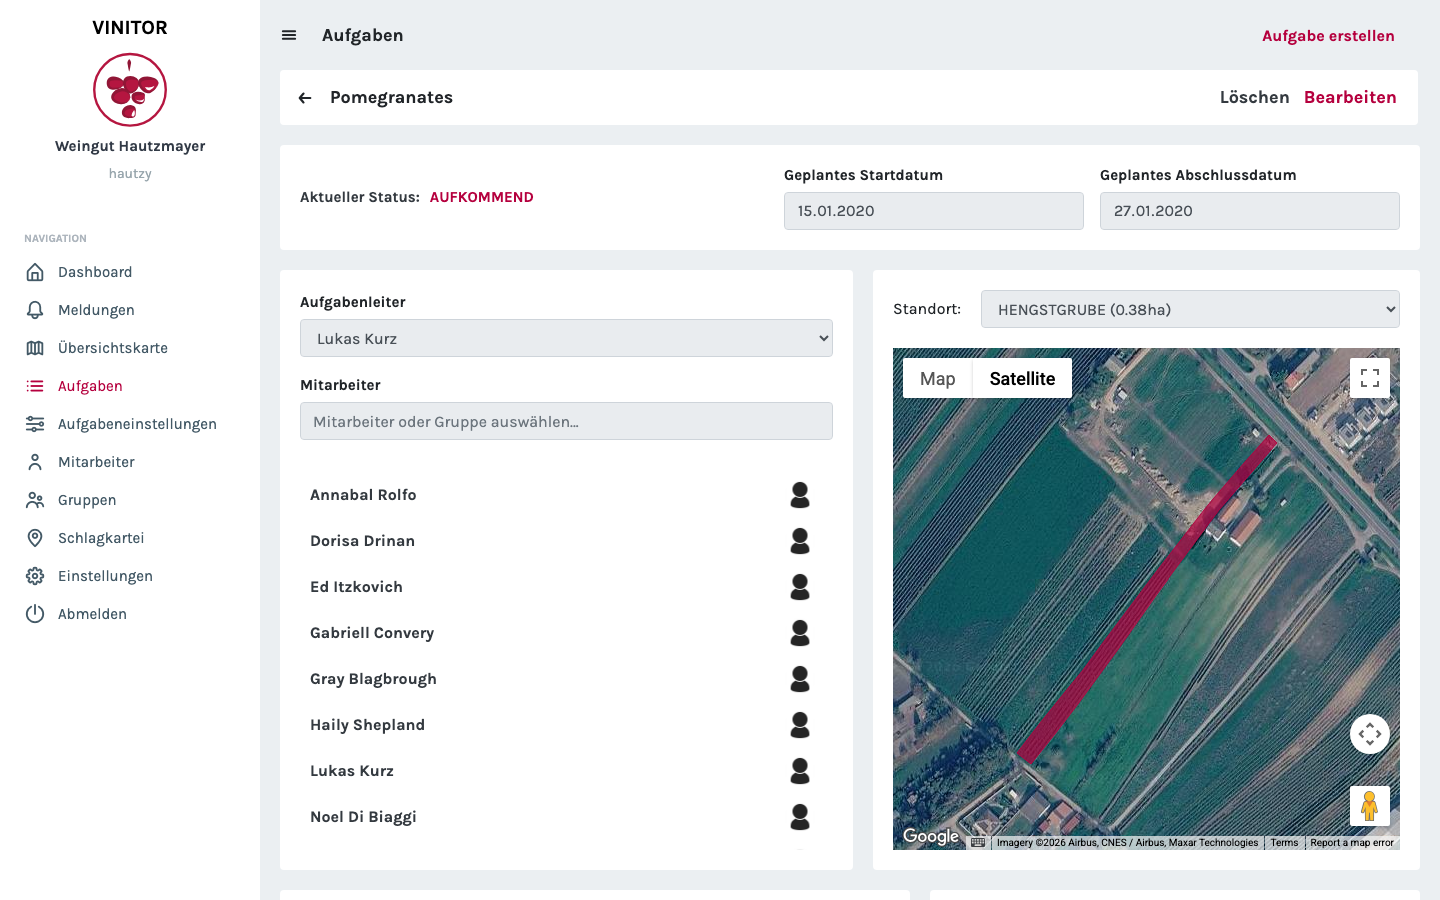
The task detail page has been completely rebuilt: master data and employees on the left, the location on the map on the right. The employee list can be extended directly by the task lead.
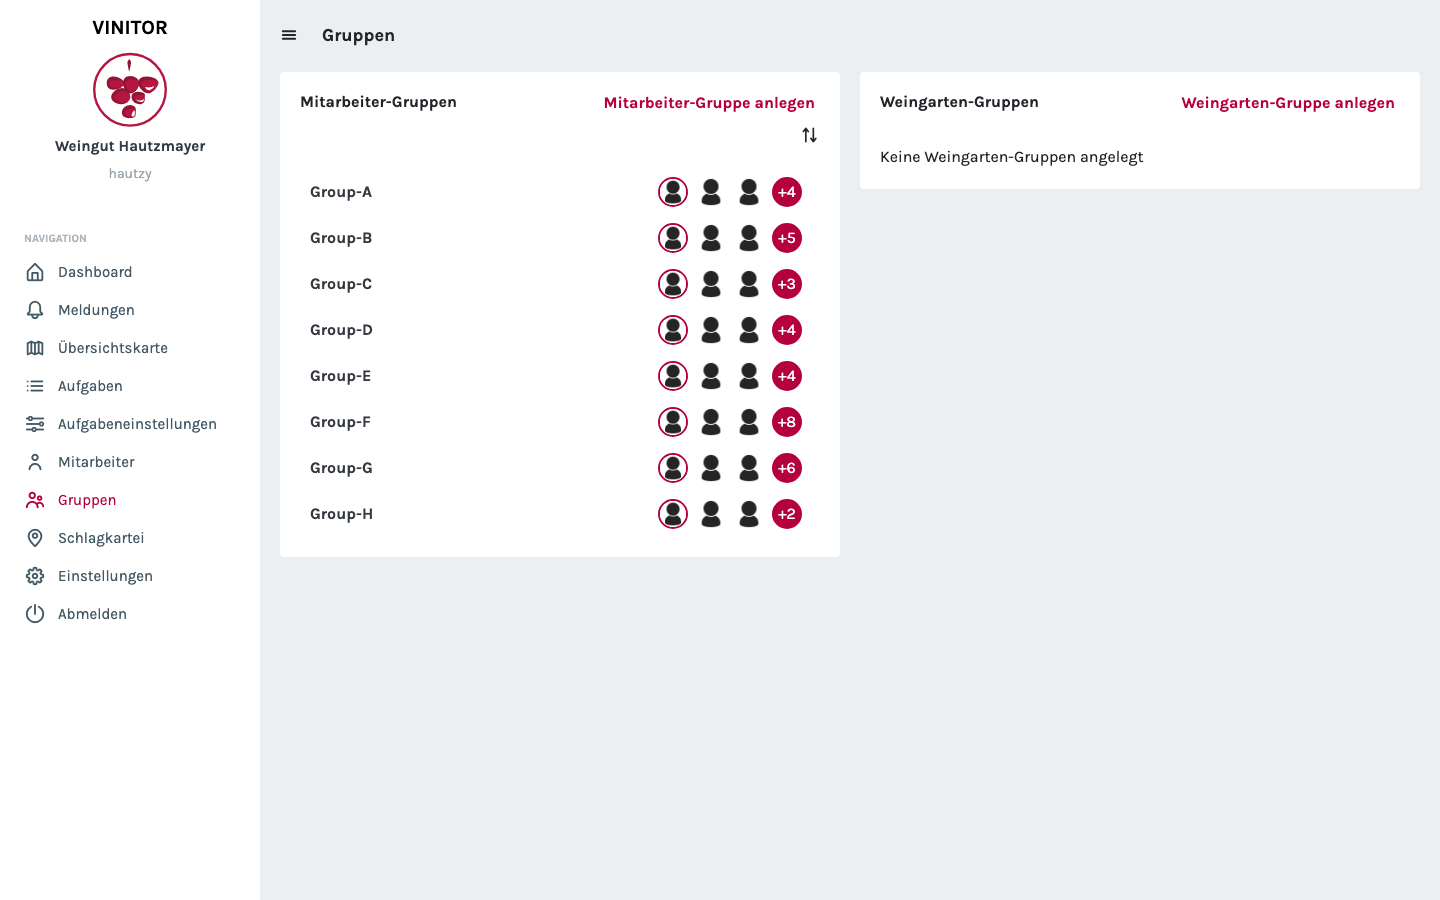
Group management now appears in a new two-column layout — employee groups on the left, vineyard groups on the right. The members of a group are shown as avatars.
✨ Improvements
- Generic fields — define your own data fields for tasks
- Interactive map overview with all vineyards and report markers
- Statistics page with filter dialogs by employee, vineyard and period
- Task detail rework with a better overview
- User group redesign with a new layout
- App support status and redirect to the App Store